

If you’re running an ecommerce business and obsessing over ROAS, it might be time to shift your focus.
Here’s the uncomfortable truth: your ROAS might look healthy, but it could be holding you back.
ROAS Looks Good – Until It Doesn’t
Let’s take a real example. One of our clients saw a 5x ROAS across Google campaigns. On paper, that’s solid. But product approvals on Google Merchant Centre dropped by over 30,000 in a single week – from 44K down to just 13.4K. Their visibility tanked. Sales dipped. And yet, their average ROAS still looked great.
That’s the problem. ROAS is a snapshot – not a growth strategy.
The Metric That Actually Drives Scale: LTV:N-CAC Ratio
The brands that scale sustainably aren’t fixated on ROAS. They track their Customer Lifetime Value (LTV) against New Customer Acquisition Cost (NCAC).
LTV:N-CAC is the ratio that tells you whether you’re building something long-term or just getting short-term wins. Here’s the simple logic:
- If you’re acquiring new customers at £30 and their 90-day value is £90, that’s a 3:1 ratio. Good.
- If you’re making £30 back on £30 spent, you’re just breaking even – with zero headroom for growth.
Why LTV:N-CAC Beats ROAS Every Time
ROAS doesn’t account for customer retention, email revenue, upsells, or post-purchase behaviour. LTV:N-CAC does. It forces you to think about the entire customer journey – not just what happens at the point of purchase.
It also gives you a clearer view of cash flow. You’ll know exactly how much you can afford to spend to acquire a customer and still hit your margin targets.
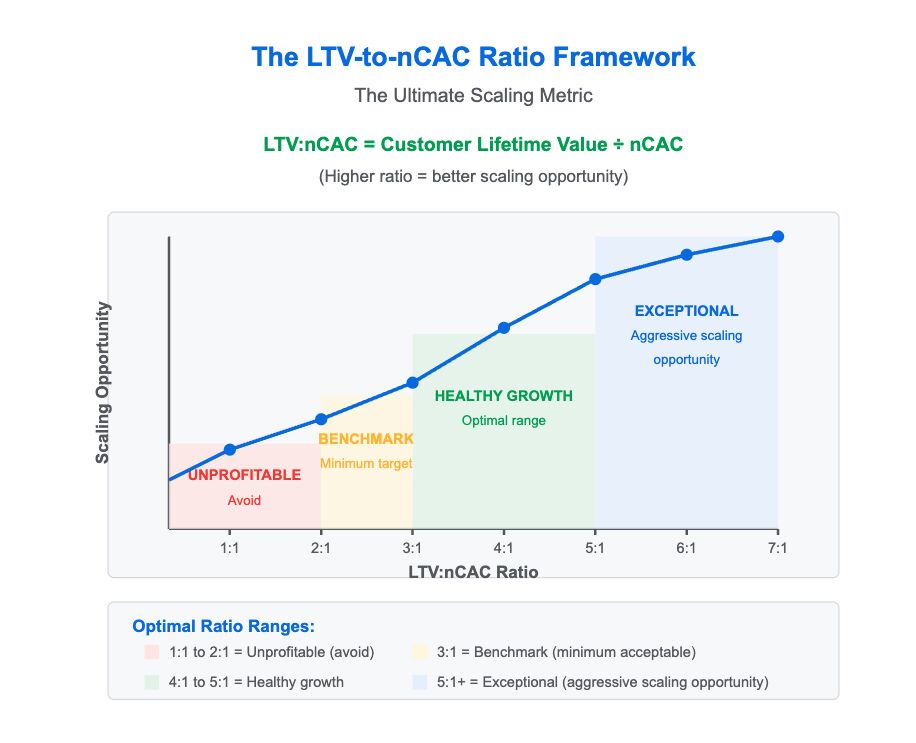
What This LTV:nCAC Ratio Chart Actually Shows
This chart shows the LTV-to-nCAC ratio, which is one of the clearest indicators of whether your ecommerce brand is positioned for scale.
Let’s decode it:
- LTV = How much value (revenue) you get from a customer over time (e.g. 60 or 90 days)
- nCAC = What it costs to acquire a new customer (not blended with repeat buyers)
- The ratio tells you how efficiently you’re acquiring customers and how valuable they are
What Each Section Means:
- 1:1 to 2:1 (Unprofitable)
You’re either paying too much for customers or they’re not spending enough. This model doesn’t scale. Avoid. - 3:1 (Benchmark)
This is the bare minimum. You’re not losing money, but there’s no real buffer for ad spend increases or retention dips. - 4:1 to 5:1 (Healthy Growth)
This is the sweet spot. You’re acquiring customers profitably and have room to reinvest in marketing. - 5:1+ (Exceptional)
Strong retention, solid margins, and you’re in a position to scale aggressively with confidence.
How PPC Marketers Can Track LTV:nCAC
Tracking this ratio isn’t difficult, but it does require a few pieces to work together. Here’s how to do it right.
1. You Need Two Numbers (from the right sources)
- LTV: Get this from your ecommerce platform or CRM (e.g. Shopify, Klaviyo, Triple Whale, Lifetimely)
- Calculate 30, 60, and 90-day LTV to see how it evolves over time
- nCAC: Use ad platform data filtered to first-time customers only
- Meta Ads, Google Ads, or third-party attribution tools (e.g. Northbeam, Triple Whale, Rockerbox)
Pro tip: If you use Google Analytics or Meta’s pixel, make sure you’re segmenting new customers, not all purchases. Blended CAC will inflate your ratio and give a false sense of performance.
2. Build or Use a Dashboard
You can build a simple dashboard in Google Sheets or Looker Studio that pulls:
- Ad spend by platform
- New customer revenue (by source or campaign)
- Rolling LTV cohorts (30/60/90 days)
- nCAC per source or channel
Or plug into a platform like:
- Triple Whale – Good for DTC brands, connects Shopify + ad spend
- Lifetimely – Excellent LTV analysis by cohort
- Daasity – More advanced but robust for high-volume brands
3. Set Targets and Monitor Weekly
Once you know your ideal LTV:nCAC ratio (e.g. 4:1), you can use it to:
- Decide whether to scale or pause ad spend
- Diagnose when ROAS looks fine but cash flow doesn’t
- Evaluate agency or platform performance with context
How Marketers Should Use This Practically
1. Calculate Your Breakeven CAC
Use your current 60-day LTV as a baseline. If LTV is £90, that’s your breakeven CAC. Spend more than that, and you’re losing money.
2. Set Your Target CAC
Pick a target LTV:nCAC ratio that suits your growth stage:
- Early-stage brand: Aim for 4:1+
- Funded or aggressive scale: You might accept 3:1 temporarily
- High-retention/subscription: You might push for 5:1 or higher
3. Build It Into Your Dashboard
Add these as reference lines in your CAC tracking dashboard. If your actual CAC crosses above target (or worse, above breakeven), it’s a red flag.